

The geography of school access
An analysis of the 2023-2026 data from the MIM (Ministry of Education and Merit) reveals that the way students reach school varies drastically from one area to another, and that the true missing infrastructure is not the schools themselves, but the roads leading to them.
The school that is most difficult to reach is not necessarily the most isolated one. By cross-referencing the Ministry's registry with the SNAI classification of municipalities, the geography of accessibility shifts, and with it, the priorities for where to invest in school transportation.
How to evaluate school accessibility
Counting schools in absolute terms is misleading. Cities, with more institutions and more students, will inevitably have higher numbers, but this does not necessarily make them the most accessible. To measure real access, we must look at the available modes of transport: urban public transport, school buses, cycle paths, and transport for students with disabilities. This set of indicators is at the heart of the analysis conducted on the 63,104 Italian schools.
A North-South gradient, rather than an isolated case
The picture that emerges is far from uniform, and it is not just a matter of individual regions: the share of schools in remote areas follows a clear gradient by macro-area. In the Islands, it is 28.4%, in the South it is 19.0%, dropping to 9.5% in the Center and just 7.0% in the North - a ratio of almost 4 to 1 between the extremes. Nationally, 34.4% of schools are located in cities, 52.2% in intermediate centers, and 13.4% in remote areas, but the real difference is not how many schools there are, but how small and scattered they are: a primary school in a remote area has an average of 92 pupils, compared to 181 in cities.
The common thread: the school bus as compensatory infrastructure
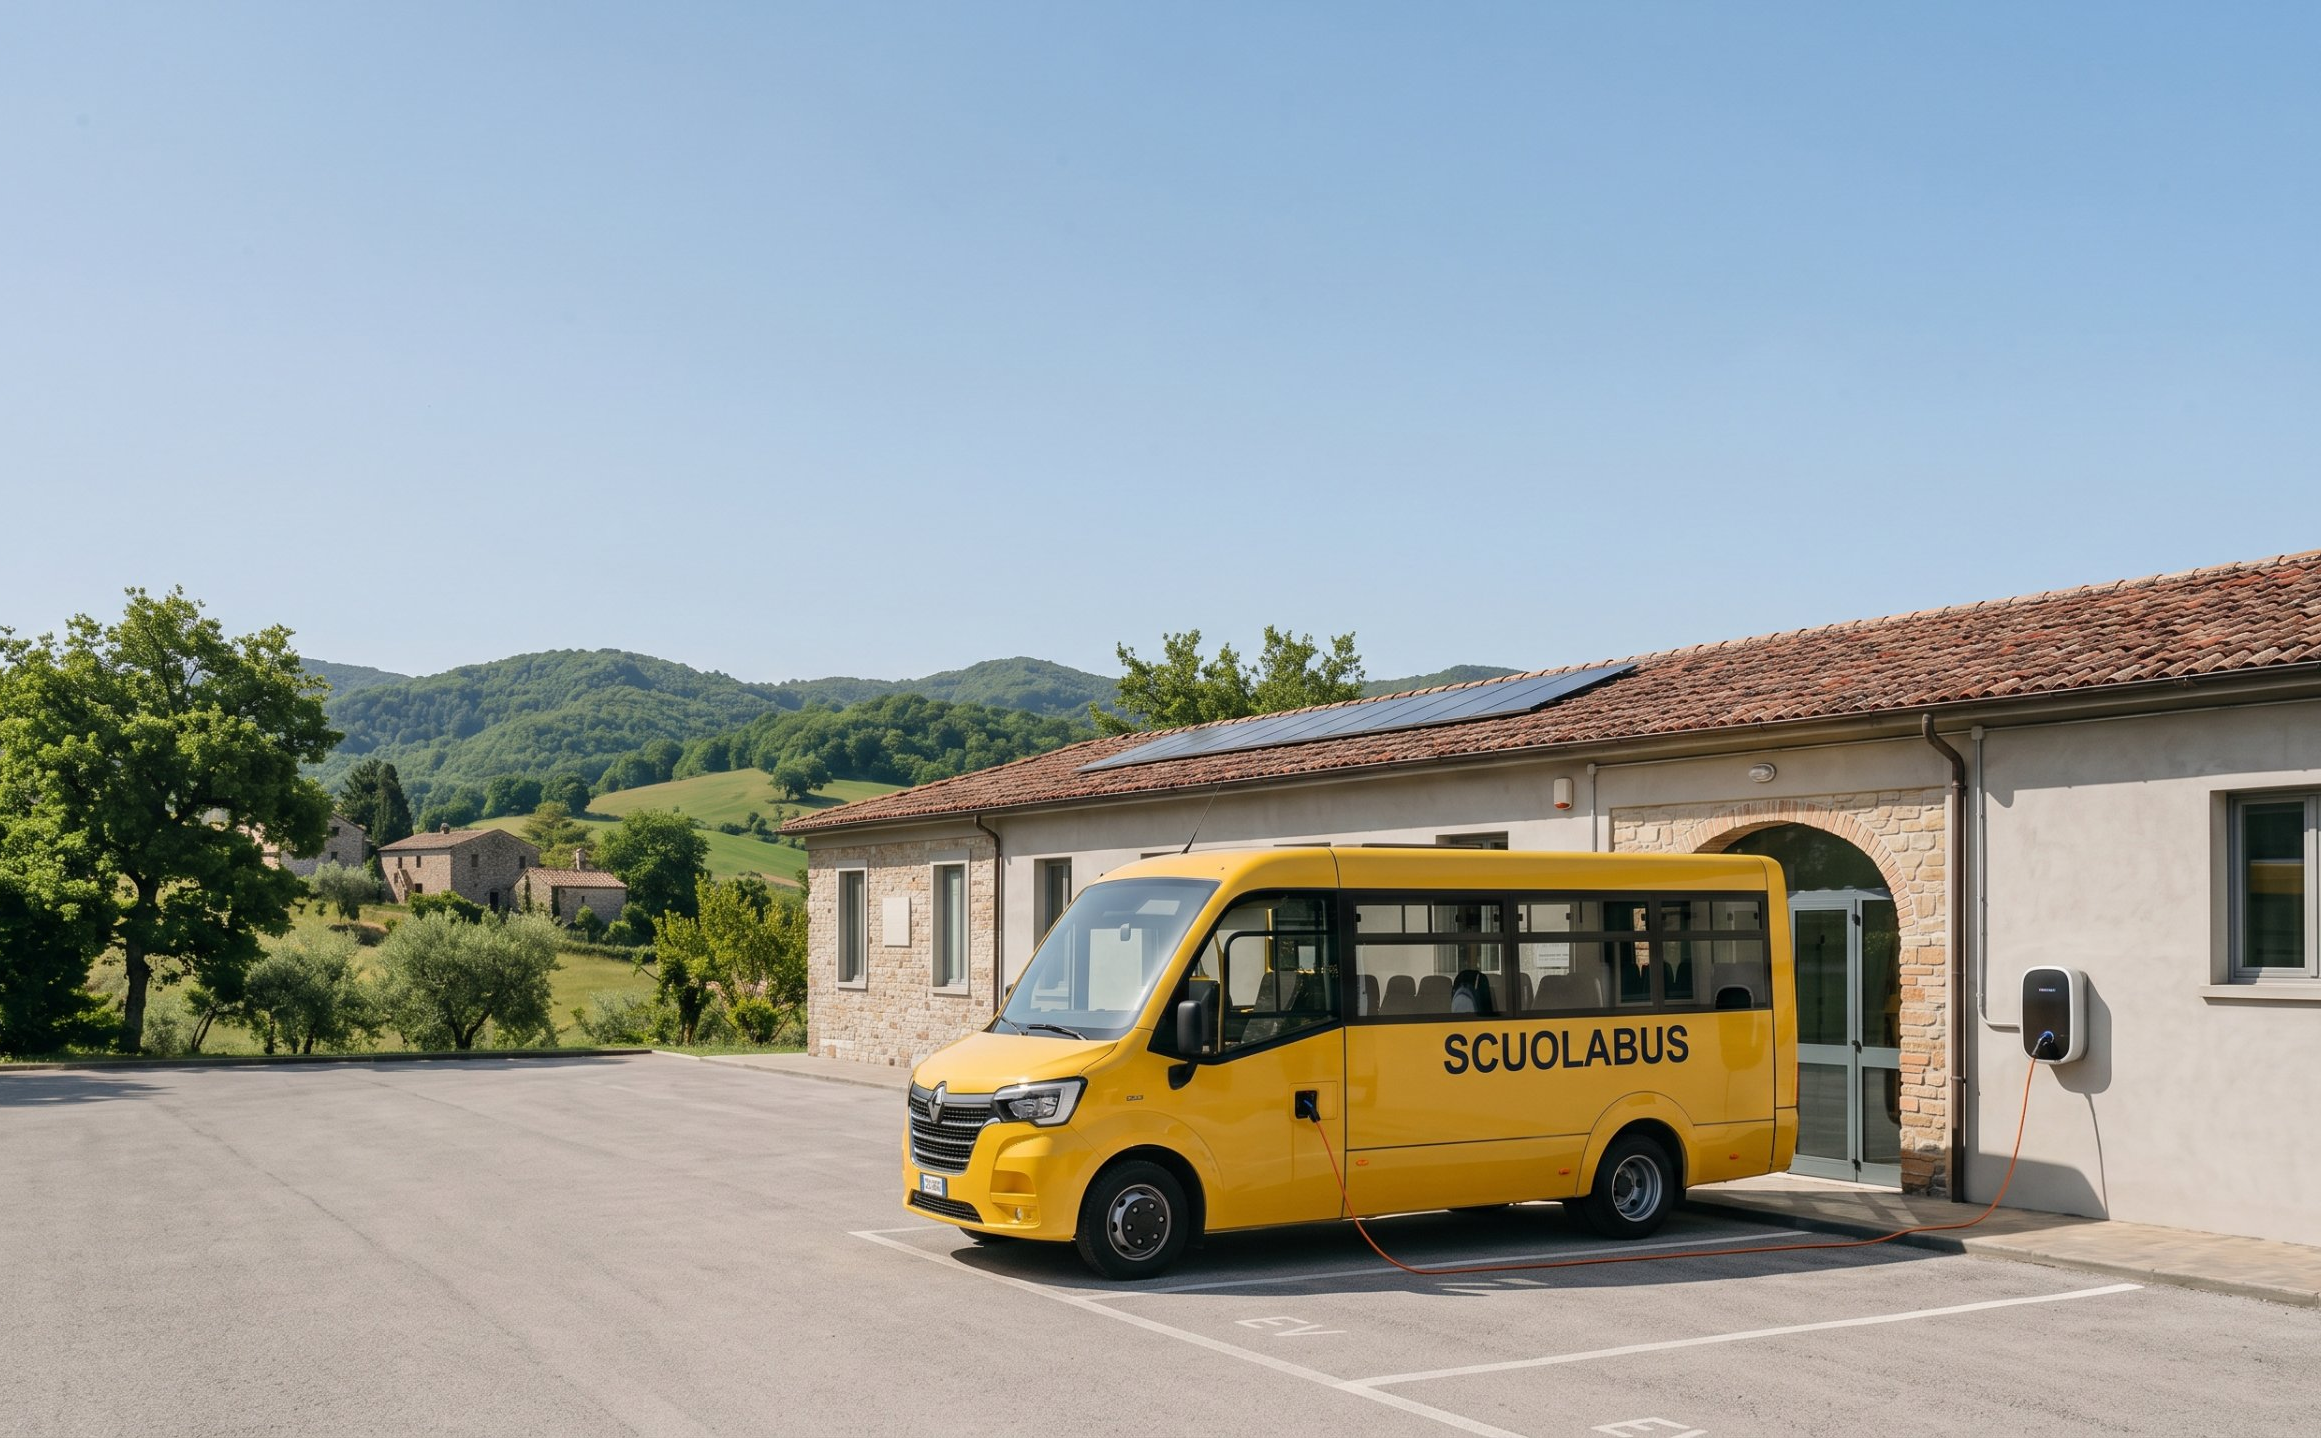
Within this geographical framework, transport tells an equally clear story. Comparing the three SNAI contexts (cities, intermediate hubs, and remote areas) reveals an almost mirror-image relationship: in cities, 78.5% of schools have public urban transport, but only 48.9% have a school bus; in remote areas, the opposite is true, with just 50.2% served by urban transport, while 76.7% are covered by school buses.
The trend is clear: as scheduled public transport decreases, school bus provision increases. However, this is not always a full compensation: bike lanes do not follow the same recovery pattern and remain an almost exclusively urban infrastructure (12.7% in cities versus 3.1% in remote areas).
Emblematic cases: Sicily, Calabria, Trentino-Alto Adige
Three regions illustrate the dynamics at play with particular clarity, and they are not all where one might expect:
● Sicily: 27.8% of schools are in remote areas, more than double the national average (13.4%). The island's mountainous terrain explains the high fragmentation of school services in the hinterland.
● Calabria: with 22.5% of schools located in remote areas, it confirms that this phenomenon is not an isolated exception but a structural issue affecting the South and the Islands.
● Trentino-Alto Adige: 37.6%, the second-highest rate in Italy after Basilicata and Molise, driven by the province of Bolzano (47.4%). This is proof that educational isolation is not just a phenomenon of the South: the Alpine landscape produces the same effect in the North.
I would interpret these data with a critical eye
The data tell an interesting story, but they require cautious interpretation on two distinct fronts. First, the percentage of school buses does not automatically imply a service quality equivalent to scheduled public transport: frequency, timetables, and territorial coverage remain variables that these indicators do not capture. Second, a synthetic accessibility index calculated at the municipal level increases similarly with both urban transport and school buses without clearly distinguishing between them; a preliminary correlation analysis does not allow us to use it as independent confirmation of the compensation relationship described above. Therefore, we treat it as purely descriptive data (2.62 in remote areas versus 3.46 in cities) rather than as evidence supporting the thesis.
It is not enough to count schools; we must look at how students reach them.
The mountains are not the problem - sometimes they are the solution
Counterintuitively, the regions with the largest mountainous areas are not those with the most schools with low accessibility (defined as lacking both urban public transport and school buses): the correlation between the two variables, calculated across the 19 regions for which data is available, is negative (r = -0.51). Valle d'Aosta, Molise, and Abruzzo - among the most mountainous territories in Italy - have some of the lowest shares of schools with low accessibility. Campania, by contrast, despite having a territory that is on average less mountainous, records the highest share overall (32.7%) — nearly double that of any other region. The geographical factor alone is not enough to explain where the school transport system is failing: local investment choices likely matter more.
A guide for accessibility policies
Macro-areas and the transport chart tell the same story from two different angles. The former shows where the phenomenon of inland areas is structurally concentrated, while the latter indicates how the response changes in terms of available means of transport. The result is an insight that must be handled with care: it is not enough to simply count schools; one must look at how students reach them. Those planning investments in school transport should calibrate their interventions based on the mix of available transport in each territory—and keep in mind that educational isolation is not just a problem in the South, as the case of Trentino-Alto Adige demonstrates.