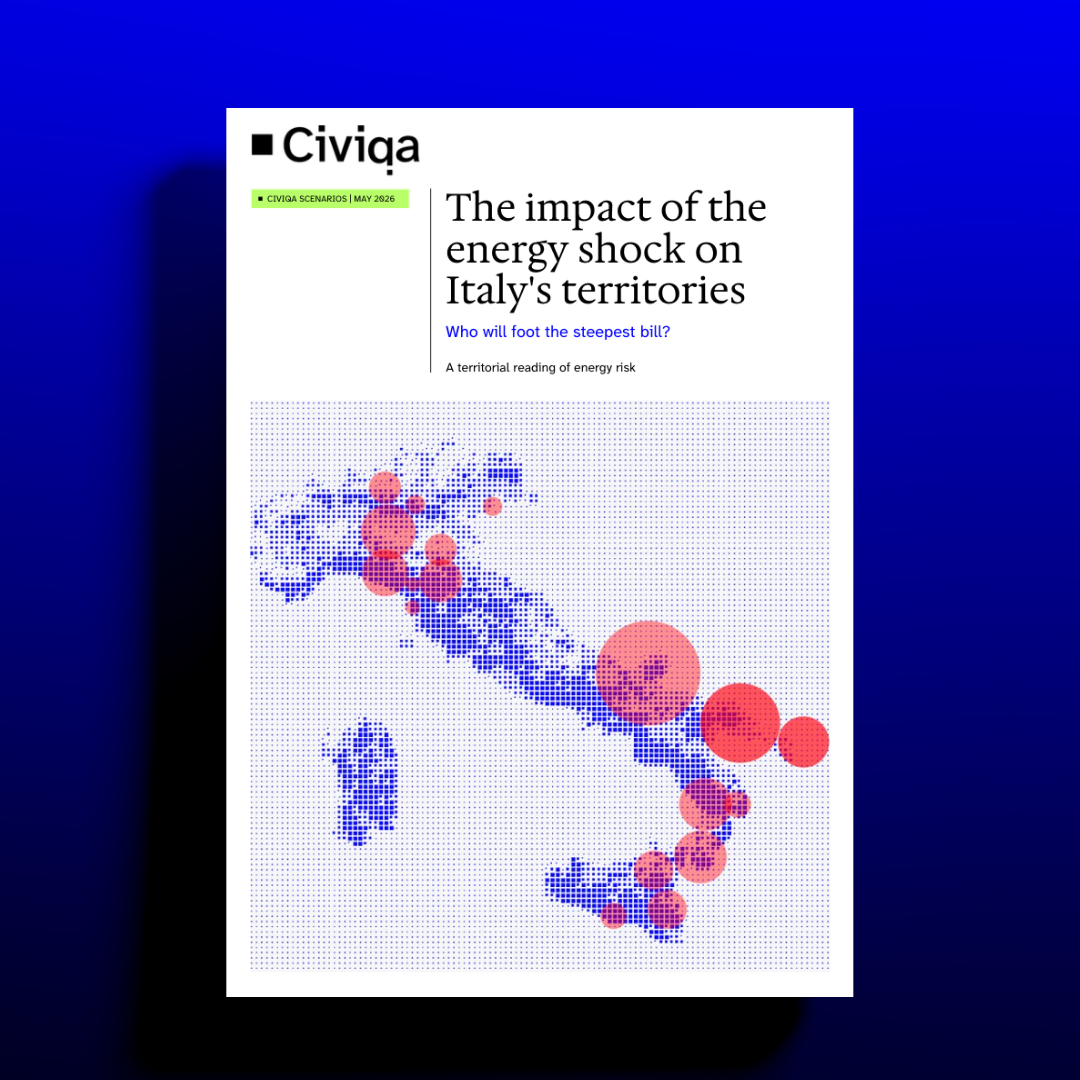
The report analyses the exposure of Italian territories to energy shocks through official data, territorial maps and a proprietary index that highlights vulnerability and resilience factors.
7890
Sources
Yes, completely. This is not a preview: it is the full report in web format, with interactive maps. For an in-depth analysis of your territory, get in touch.
The EEI index is calculated for all 7,890 Italian municipalities with at least 500 residents. All provinces and regions are included.
The reference year for the data is 2022 — the latest year with full municipal-level coverage. The report was updated in May 2026.
The report is web-based and interactive, and so are the maps. The PDF version is available to download, but the maps are static. In the Scenarios section of the Civiqa website, we plan to publish further insights with even more detailed maps and charts.
Yes, freely. We recommend inviting them to register, so they can receive any future updates and insights.